
The San Bernardino Pacesetters Drill Team & Drum Squad
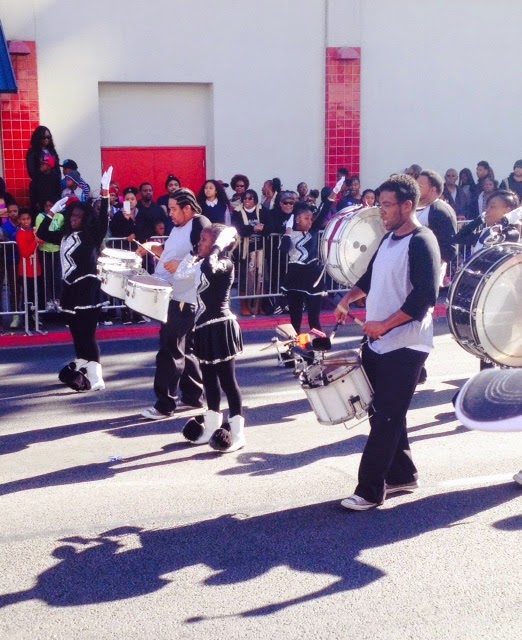 The San Bernardino Pacesetters Drill Team & Drum Squad


Buffalo Soldiers Motorcycle Club of Las Vegas


Rank
|
Ethnicity
|
2010 District of
Columbia Population
|
As a
Percent of
Total District of Columbia Population |
Total Population
|
604,453
|
100.00%
|
|
1
|
African-American*
|
279,116
|
46.18%
|
2
|
Irish
|
41,980
|
6.95%
|
3
|
German
|
39,294
|
6.50%
|
4
|
English
|
31,100
|
5.15%
|
5
|
Salvadoran
|
19,112
|
3.16%
|
6
|
Italian
|
16,444
|
2.72%
|
7
|
French,
except Basque
|
10,981
|
1.82%
|
8
|
African
|
10,011
|
1.66%
|
9
|
Polish
|
9,997
|
1.65%
|
10
|
Russian
|
9,862
|
1.63%
|
11
|
Mexican
|
9,353
|
1.55%
|
12
|
European
|
7,962
|
1.32%
|
13
|
American
|
7,181
|
1.19%
|
14
|
Scottish
|
6,994
|
1.16%
|
15
|
Chinese,
except Taiwanese |
6,079
|
1.01%
|
16
|
Ethiopian
|
4,779
|
0.79%
|
17
|
Asian
Indian
|
4,759
|
0.79%
|
18
|
Eastern
European
|
4,642
|
0.77%
|
19
|
Swedish
|
4,522
|
0.75%
|
20
|
British
|
4,134
|
0.68%
|
21
|
Dutch
|
4,078
|
0.67%
|
22
|
Puerto
Rican
|
3,864
|
0.64%
|
23
|
Scotch-Irish
|
3,582
|
0.59%
|
24
|
Honduran
|
3,084
|
0.51%
|
25
|
Jamaican
|
3,056
|
0.51%
|
26
|
Korean
|
2,952
|
0.49%
|
27
|
Hungarian
|
2,946
|
0.49%
|
28
|
Welsh
|
2,941
|
0.49%
|
29
|
Norwegian
|
2,923
|
0.48%
|
30
|
Greek
|
2,775
|
0.46%
|
31
|
Dominican
(Dominican Republic) |
2,649
|
0.44%
|
32
|
Nigerian
|
2,332
|
0.39%
|
33
|
Peruvian
|
2,232
|
0.37%
|
34
|
Filipino
|
2,194
|
0.36%
|
35
|
Cuban
|
2,134
|
0.35%
|
36
|
Austrian
|
2,091
|
0.35%
|
37
|
American
Indian and Alaska Native
|
1,927
|
0.32%
|
38
|
Ukrainian
|
1,854
|
0.31%
|
39
|
Swiss
|
1,808
|
0.30%
|
40
|
Guatemalan
|
1,785
|
0.30%
|
41
|
Nicaraguan
|
1,772
|
0.29%
|
42
|
West
Indian
|
1,750
|
0.29%
|
43
|
Lebanese
|
1,720
|
0.28%
|
44
|
Bolivian
|
1,623
|
0.27%
|
45
|
Scandinavian
|
1,564
|
0.26%
|
46
|
Lithuanian
|
1,503
|
0.25%
|
47
|
French
Canadian
|
1,494
|
0.25%
|
48
|
Vietnamese
|
1,412
|
0.23%
|
49
|
Portuguese
|
1,368
|
0.23%
|
50
|
Romanian
|
1,300
|
0.22%
|