Monday, December 5, 2016

Pilsen, Chicago

The artwork of Chicago's Pilsen Mexican-American neighborhood.
 Donald Trump is not too popular.

Tribute to the SS Eastland tragedy in 1915.


 Saint Procopius Church display for Day of the Dead.

Saint Procopius Church display for Day of the Dead.

Saint Procopius Church display for Day of the Dead


Galeria Del Barrio, by Aurelio Diaz


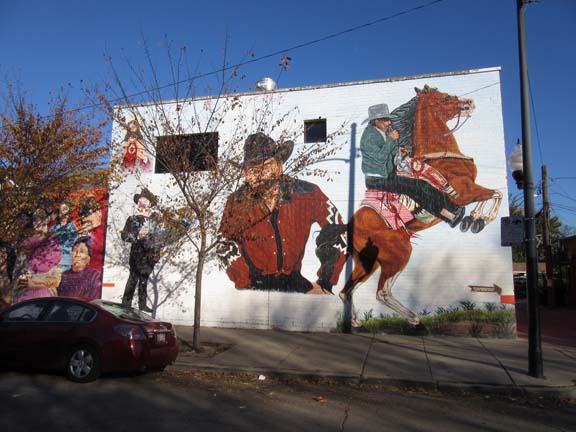
Mural by Aurelio Diaz.


Monday, November 21, 2016

Reconciliation Mural


Uptown is a diverse Chicago neighborhood plagued with many urban ills. In 1995 director at the Uptown Baptist Church thought to replace graffiti that covered a storefront with a mural that would communicate God's love for the neighborhood. The fruit of his work is the Reconciliation Mural.

Sunday, October 30, 2016

Saturday, October 22, 2016

Clinton's success with European-American Catholic voters

Ever since the days of the "Reagan Democrats", European-American Catholics increasingly vote Republican. However the Clinton campaign sees an opening, and polls show she's winning this important demographic. The shift towards Clinton owes partly to the recent sexual harassment scandals involving Trump that offend many of the devout. At the same time Pope Francis' has moved the church to emphasize service to the poor versus issues of morality like abortion and gay rights.

Saturday, September 24, 2016

Bosnian Americans play a pivotal role in presidential election

During a previous religious based world conflict, it was Bosnian Muslim refugees who arrived in the US seeking refuge. Many settled in Saint Louis, Missouri. That state is considered a swing state in national politics, with recent polls show Missouri in a dead heat between support for Trump and Clinton. Bosnian and Kosovar immigrants in the St. Louis are could play a role in pushing Missouri over the top for Clinton. Although of European origin, these groups are still mostly Muslim, and are disheartened by Trump's anti immigrant and anti-Muslim rhetoric.

Friday, August 26, 2016

Priedaine

Priedaine, the cultural center of the New Jersey Latvian Society.


Friday, June 10, 2016

The Thai-American population

California has the largest Thai population of any state, while Nevada's Thai community is the largest in terms of percentage of total population. Here is a look at all states:


Thai-American Population


Thai-Americans as a Percentage of Total Population

United States
177,445
1
Nevada
0.21%
1
California
51,089
2
Alaska
0.18%
2
Texas
12,642
3
Hawaii
0.14%
3
New York
11,531
4
California
0.14%
4
Florida
9,483
5
Washington
0.09%
5
Virginia
7,411
6
Rhode Island
0.09%
6
Illinois
7,366
7
Virginia
0.09%
7
Washington
6,371
8
District of Columbia
0.09%
8
Nevada
5,698
9
Maryland
0.08%
9
Georgia
4,909
10
Oregon
0.08%
10
Arizona
4,716
11
Arizona
0.07%
11
Maryland
4,432
12
Oklahoma
0.06%
12
North Carolina
3,878
13
Minnesota
0.06%
13
Minnesota
3,333
14
New York
0.06%
14
New Jersey
3,326

United States
0.06%
15
Oregon
2,887
15
Illinois
0.06%
16
Ohio
2,799
16
Iowa
0.06%
17
Pennsylvania
2,755
17
Colorado
0.05%
18
Colorado
2,700
18
Kansas
0.05%
19
Oklahoma
2,440
19
Georgia
0.05%
20
Massachusetts
2,346
20
Florida
0.05%
21
Hawaii
1,939
21
Connecticut
0.05%
22
Tennessee
1,834
22
Texas
0.05%
23
Connecticut
1,793
23
North Carolina
0.04%
24
Iowa
1,738
24
New Mexico
0.04%
25
Michigan
1,593
25
New Jersey
0.04%
26
Kansas
1,477
26
Massachusetts
0.04%
27
Alaska
1,311
27
Utah
0.03%
28
Indiana
1,250
28
Tennessee
0.03%
29
Missouri
1,064
29
Ohio
0.02%
30
Kentucky
1,052
30
Kentucky
0.02%
31
Rhode Island
989
31
New Hampshire
0.02%
32
South Carolina
939
32
Pennsylvania
0.02%
33
Utah
918
33
South Carolina
0.02%
34
Wisconsin
887
34
Indiana
0.02%
35
New Mexico
805
35
Missouri
0.02%
36
Louisiana
585
36
Arkansas
0.02%
37
District of Columbia
539
37
Michigan
0.02%
38
Arkansas
501
38
Wisconsin
0.02%
39
Alabama
362
39
Louisiana
0.01%
40
New Hampshire
307
40
Alabama
0.01%
41
Delaware
0
41
Delaware
0.00%
42
Idaho
0
42
Idaho
0.00%
43
Maine
0
43
Maine
0.00%
44
Mississippi
0
44
Mississippi
0.00%
45
Montana
0
45
Montana
0.00%
46
Nebraska
0
46
Nebraska
0.00%
47
North Dakota
0
47
North Dakota
0.00%
48
South Dakota
0
48
South Dakota
0.00%
49
Vermont
0
49
Vermont
0.00%
50
West Virginia
0
50
West Virginia
0.00%
51
Wyoming
0
51
Wyoming
0.00%

Source: U.S. Census Bureau, 2010 American Community Survey
B02006 Asian Alone by Selected Groups, 1 year estimates
C02006 Asian Alone by Selected Groups, 1 year estimates