Disturbing images broadcast from Chicago earlier this month via FaceBook Live when 4 Black teenagers taped their torture of a mentally challenged White teen.
The boy was kidnapped, gagged, burned and cut repeatedly. Through out the attack the perpetrators uttered anti-White epithets and insults.
Most politicians condemned it as the hate crime that it was, including prominent Black leaders like President Obama. At the same time it's sad that some otherwise well-meaning social justice advocates and media commentators shy away from calling this crime what it was: an act of hate against both the disabled and a White person. It's as if they are possessive over who can be the recipient of hate, and who can only be the perpetrator.
Hate crime legislation was originally enacted to protect society's most vulnerable citizens. However that does not preclude a minority from committing an act of hate, not does it disqualify a targeted attack against a white person as a hate crime.
Make no mistake, condemning an attack on a mentally disabled young man is not a conservative rallying call, but rather human compassion.
Showing posts with label Illinois. Show all posts
Showing posts with label Illinois. Show all posts
Tuesday, January 24, 2017

Monday, December 5, 2016
Pilsen, Chicago
The artwork of Chicago's Pilsen Mexican-American neighborhood.


Donald Trump is not too popular.

Tribute to the SS Eastland tragedy in 1915.


Saint Procopius Church display for Day of the Dead.

Saint Procopius Church display for Day of the Dead.

Saint Procopius Church display for Day of the Dead


Galeria Del Barrio, by Aurelio Diaz

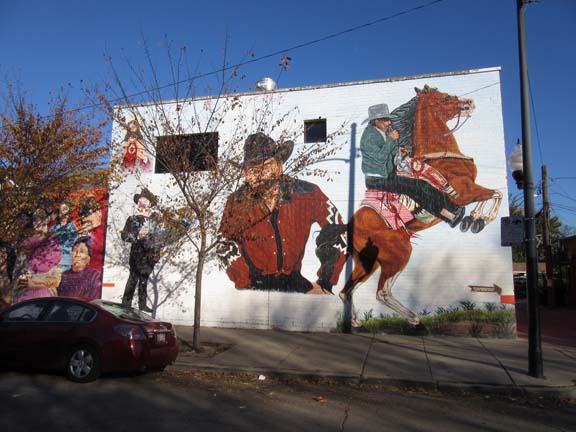
Mural by Aurelio Diaz.

Monday, November 21, 2016
Reconciliation Mural

Uptown is a diverse Chicago neighborhood plagued with many urban ills. In 1995 director at the Uptown Baptist Church thought to replace graffiti that covered a storefront with a mural that would communicate God's love for the neighborhood. The fruit of his work is the Reconciliation Mural.
Friday, February 6, 2015
Saints Volodymyr and Olha Ukrainian Church
Saints Volodymyr and Olha Ukrainian Church is one of the newer parishes in Chicago's Ukrainian Village. It was founded by Patriarch Josyf Slipyj, and construction of the building was completed in 1973.

The gold some of the church as seen from West Chicago Avenue. The architecture follows a Ukrainian-Byzantine style of the 11- 13th centuries.

The exterior of the church features a mosaic above the entrance depicting the Christianization of Ukraine.

Statue of the church's founder, Patriarch Josyf Slipyj

Statue of the church's founder, Patriarch Josyf Slipyj

Monday, January 5, 2015
Chicago's Ukrainian Village
Between 1880 and 1910 Ukrainians migrated in large numbers to the west Chicago neighborhood now known as Ukrainian Village. As with other ethnic enclaves, the neighborhood's Ukrainian population declined with the rise of suburbanization after World War II. While the Ukrainian-American population is just a fraction of what it once was, the Ukrainian influence remains, as seen in the district's many Ukrainian institutions and ornate churches.

Memorial statue outside Ukrainian Cultural Center of Saint Volodymyr and Princess Olha.

Doors of the Saint Nicholas Cathedral School

Ukraina Deli, West Chicago Avenue

Ukrainian flags on display, North Oakley Boulevard

Ukrainian Village Street Sign

Van with Ukrainian flag

Old Lviv Restaurant, West Chicago Avenue
Wednesday, December 17, 2014
Andersonville, Chicago
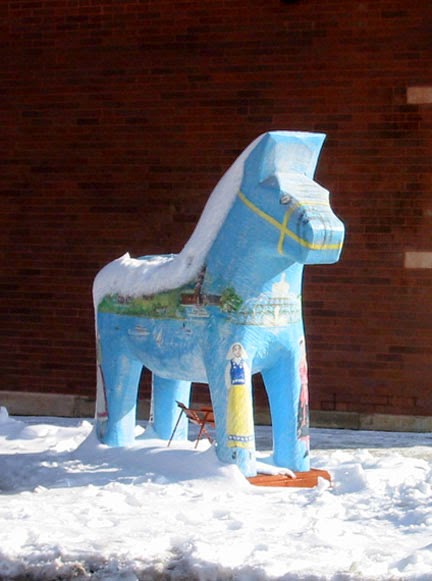
Andersonville is a residential neighborhood on the north side of Chicago. For most of the 20th century is was a destination for Swedish immigrants arriving to the metropolitan area. Like most ethnic enclaves, Andersonville saw much of it's Swedish-American population gravitate towards the suburbs after World War II. Yet many of the neighborhood's Swedish institutions and businesses remain, like the Swedish American Museum and restaurants like Svea. The quintessential landmark is the blue and yellow painted Anderson Water Tower.Today Andersonville is a destination for many new ethnic groups. It is also known as a welcoming neighborhood for the city's gay community.


Friday, October 31, 2014
Pilsen, Chicago
Scenes from Pilsen, a heavily Mexican-American enclave in Chicago, as it prepares for Día de los Muertos, otherwise known as Day of the Dead.

Coyotes Restaurant, West 18th Street

Bombon, West 18th Street

Mural painted on house on South Allport Street

Street vendor on West 18th Street

House decorated on South Allport Street

Poder Learning Center, South Allport Street

"Si se puede" poster, Perez Family Restaurant, West 18th Street

Street mural, West 18th Street

Artesanias D'Mexico, West 18th Street
Friday, April 4, 2014
Illinois' Largest Ethnic Groups
Chicago's status as an industrial powerhouse and a transportation hub in the 1800's made it a magnet for immigrants. This shows in the diversity of ethnic backgrounds in Illinois. German-Americans are the state's largest ethnic group, the background of almost 1 in 5 residents.
Rank
|
Ethnicity
|
2010
Illinois Population |
As a
Percent of
Total Illinois Population |
Total Population
|
12,843,166
|
100.00%
|
|
1
|
German
|
2,509,602
|
19.54%
|
2
|
African-American*
|
1,746,922
|
13.60%
|
3
|
Mexican
|
1,620,432
|
12.62%
|
4
|
Irish
|
1,598,702
|
12.45%
|
5
|
Polish
|
970,053
|
7.55%
|
6
|
Italian
|
794,985
|
6.19%
|
7
|
English
|
786,693
|
6.13%
|
8
|
American
|
613,029
|
4.77%
|
9
|
Swedish
|
281,076
|
2.19%
|
10
|
French,
except Basque
|
244,045
|
1.90%
|
11
|
Puerto
Rican
|
194,096
|
1.51%
|
12
|
Dutch
|
190,070
|
1.48%
|
13
|
Asian
Indian
|
186,955
|
1.46%
|
14
|
Norwegian
|
165,590
|
1.29%
|
15
|
Scottish
|
142,872
|
1.11%
|
16
|
Czech
|
133,127
|
1.04%
|
17
|
European
|
130,534
|
1.02%
|
18
|
Russian
|
126,227
|
0.98%
|
19
|
Filipino
|
114,593
|
0.89%
|
20
|
Chinese,
except Taiwanese
|
106,341
|
0.83%
|
21
|
Greek
|
94,513
|
0.74%
|
22
|
Lithuanian
|
89,014
|
0.69%
|
23
|
Scotch-Irish
|
79,490
|
0.62%
|
24
|
Korean
|
58,160
|
0.45%
|
25
|
Hungarian
|
50,230
|
0.39%
|
26
|
Ukrainian
|
49,755
|
0.39%
|
27
|
Danish
|
46,584
|
0.36%
|
28
|
Welsh
|
45,902
|
0.36%
|
29
|
Croatian
|
43,323
|
0.34%
|
30
|
Austrian
|
39,060
|
0.30%
|
31
|
Slovak
|
38,999
|
0.30%
|
32
|
African
|
38,755
|
0.30%
|
33
|
Guatemalan
|
36,524
|
0.28%
|
34
|
Swiss
|
35,939
|
0.28%
|
35
|
Belgian
|
35,483
|
0.28%
|
36
|
French
Canadian
|
35,286
|
0.27%
|
37
|
British
|
33,086
|
0.26%
|
38
|
Vietnamese
|
29,763
|
0.23%
|
39
|
Pakistani
|
29,030
|
0.23%
|
40
|
Romanian
|
28,373
|
0.22%
|
41
|
Arab
|
26,199
|
0.20%
|
42
|
Cuban
|
25,321
|
0.20%
|
43
|
Ecuadorian
|
24,693
|
0.19%
|
44
|
Colombian
|
24,060
|
0.19%
|
45
|
Eastern
European
|
21,341
|
0.17%
|
46
|
Serbian
|
20,878
|
0.16%
|
47
|
Yugoslavian
|
20,237
|
0.16%
|
48
|
Japanese
|
18,271
|
0.14%
|
49
|
Bulgarian
|
16,955
|
0.13%
|
50
|
Czechoslovakian
|
16,890
|
0.13%
|
Source: US Census Bureau, 2010 American Community Survey
1 year estimates, tables: B02001, C02005, B02006,
C02007, B03001, B03002, B04006
* African-American is derived as respondents selecting Black as racial group after removing African, West Indian, and Hispanic ethnicities.
Subscribe to:
Posts (Atom)